 This is an isopleth in which isolines connect points of equal magnitudes.
Sunday, November 30, 2008


Saturday, November 29, 2008
Isohyets

The colorful contour lines are used to determine the various amounts of percipitation in an area. This is useful when prepare annual rainfall reports.
Wednesday, November 26, 2008
Isotachs
 The wavy lines on this map is known as isotachs, these are needed to determine wind speeds along with isobars which are recorded in kilometers per hour.
Isobars
 The curvy lines in this image are known as Isobars, which depict pressure gradients of an area. The isobars in this photo are fair close which indicates a steep pressure system moving through.
LIDAR
 This process is known as LIDAR, in simple terms an elevation map. The information obtained using the LIDAR technique is merely reflection data using a laser beam to obtain elevation differences, which is useful in determining topographic changes.
Doppler Radar

This is an image enhanced radar derived data product obtained over a period of time using the doppler effect to diagnose the weather of a given area.
Black and White Aerial photo
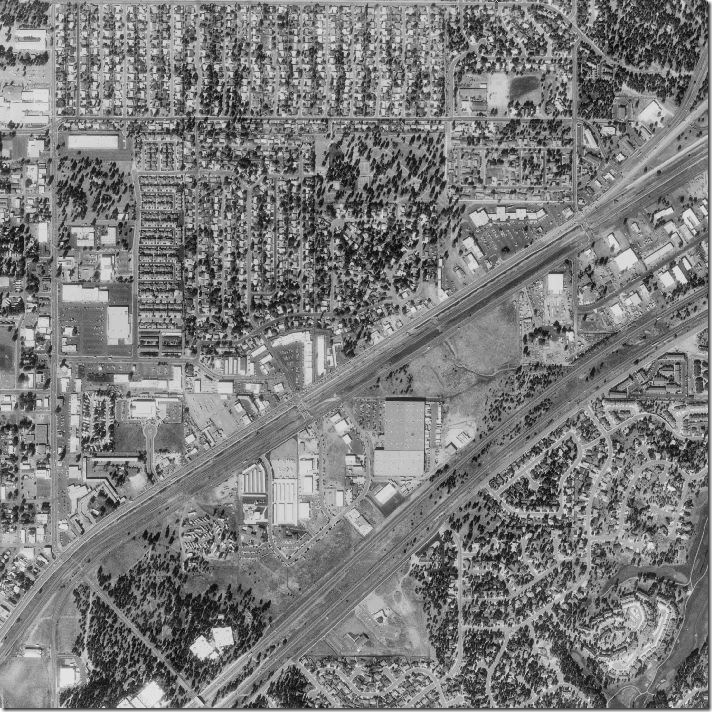 Also known as orthophoto, this black and white aerial high altitude images provide great detail of the area. From this high view once can see the differences in terrain relief which can be very useful when it comes to updating surface features on maps.
Infrared Aerial Map
 This photo is a "sky" view using infrared aerial mapping, which is most useful for planning Agriculture. Different color tones have different meanings for instance, this shot contains mostly live vegetation which is denoted in red. The green coloring denotes dead vegetation, whereas the blue represents ground and can vary in color depending on the moisture content it holds.
Cartographic Animation

This is an example of cartographic animation it is real time animation that changes as the event changes. These maps are user defined and the information generated is a result of what is questioned, in the case it is cancer deaths in Nebraska County.
Statistical Map

"Statistical map of Napoleon’s Russian campaign of 1812 ", the map provides the temperature pattern experienced during August - October. As well as a statistic count of soldiers and their advancement or retreat.
Cartograms
 I would love to tell you what this cartograms represents but I can't because it is in Spanish. What I can tell you is that is picture represent the same statistical data but at different valuations, hence the enlarged shapes. Cartograms are based upon size depictions but the positioning and approximately scales are as close as possible to the original.
Thursday, November 20, 2008

Sunday, November 9, 2008
Isoline Map
 This is an Isoline map used to display the weather within the United States that will be experiencing a cold front on this particular day. This particular map is called an Isotherm because it is pertaining to temperatures.
Wednesday, November 5, 2008
Proportional Circle Map
This is a proportional map which shows the composition of the surround bodies of water. Each circle is sized and colored according to the color of the body of water it represents and the size of gravel and the rocks within that body of water. 
Saturday, November 1, 2008
Choropleth Map
 This is a chloropleth map of water usage per State for the continuos United States. The designer of this map has chosen to various forms of blue to represent consumption usage.
Subscribe to:
Posts (Atom)