skip to main
|
skip to sidebar
Maps to the T
Tuesday, December 2, 2008
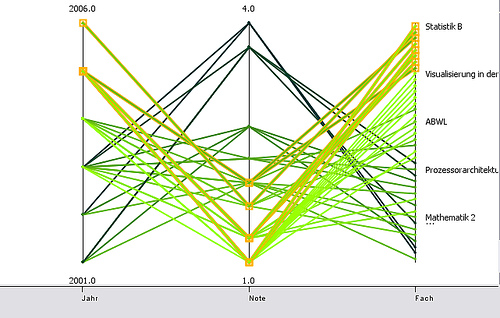
Parallel Coordinate Graph
Parallel Coordinate graphs are merely visualized clutters. This graph attempts to plot multivariate analysis on the same graph but this causes confusion and inconsistencies with readings.
No comments:
Post a Comment
Newer Post
Older Post
Home
Subscribe to:
Post Comments (Atom)
Blog Archive
▼
2008
(50)
▼
December
(24)
Star Plots
Correlation Matrix
Similarity Matrix
Stem and leaf plot
Box Plot
Histograms
Parallel Coordinate Graph
Triangular Plot
Windrose
Climograph
Population Profile
Scatterplot
Index Value Plot
Accumulative Line Graph
Bilateral Graph
Nominal Area Choropleth Map
Standardized Choropleth Map
Bivariate Choropleth Map
Unclassed Choropleth Maps
Classed Choropleth Maps
Continously Variable Proportional Circle Map
DOQQ
DEM
DLG
►
November
(17)
►
October
(9)
About Me
Maps to the T
View my complete profile
 Parallel Coordinate graphs are merely visualized clutters. This graph attempts to plot multivariate analysis on the same graph but this causes confusion and inconsistencies with readings.
No comments:
Post a Comment